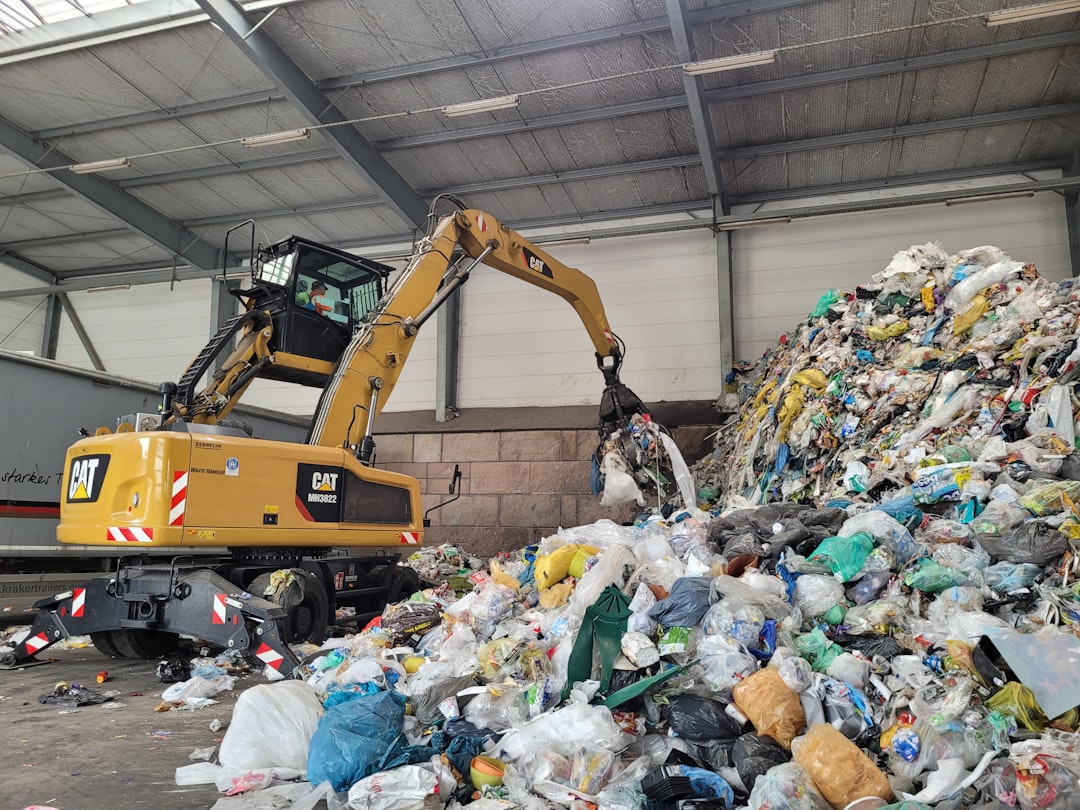
Garbage collection is a crucial aspect of memory management in programming languages, particularly those that support automatic memory management, such as Java, C#, and Python. At its core, garbage collection is the process of identifying and reclaiming memory that is no longer in use by the program. This is essential because it helps prevent memory leaks, which occur when a program allocates memory but fails to release it back to the system, leading to increased memory consumption and potential application crashes.
The garbage collector (GC) operates in the background, automatically freeing up memory that is no longer reachable or needed by the application. The concept of garbage collection emerged as a solution to the complexities associated with manual memory management. In languages like C and C++, developers are responsible for explicitly allocating and deallocating memory using functions like `malloc` and `free`.
This manual approach can lead to errors such as double freeing memory or forgetting to free allocated memory altogether. Garbage collection alleviates these issues by automating the process, allowing developers to focus on writing code rather than managing memory. However, while garbage collection simplifies memory management, it introduces its own set of challenges, including performance overhead and unpredictable pauses during program execution.
Key Takeaways
- Garbage collection automates memory management by reclaiming unused objects to prevent memory leaks.
- Various algorithms like mark-and-sweep, reference counting, and generational collection address different performance needs.
- Common issues include memory leaks, fragmentation, and excessive pause times affecting application performance.
- Optimizing garbage collection involves tuning parameters and choosing appropriate algorithms based on workload characteristics.
- Monitoring tools and best practices help maintain efficient memory usage and prepare for emerging trends in garbage collection technology.
Types of Garbage Collection Algorithms
There are several types of garbage collection algorithms, each with its own strengths and weaknesses. One of the most common algorithms is the mark-and-sweep algorithm. This two-phase process begins with the “mark” phase, where the garbage collector traverses the object graph starting from root references (such as global variables and active stack frames) to identify all reachable objects.
Once this marking is complete, the “sweep” phase follows, where the collector scans through the heap memory and deallocates any objects that were not marked as reachable. While effective, this algorithm can lead to fragmentation in memory, as it does not compact the heap after sweeping. Another widely used algorithm is generational garbage collection, which is based on the observation that most objects have a short lifespan.
In this approach, the heap is divided into different generations: young, old, and sometimes permanent generations. Newly created objects are allocated in the young generation, where they are frequently collected. If they survive several garbage collection cycles, they are promoted to the old generation.
This method optimizes performance by focusing on collecting short-lived objects more frequently while minimizing the overhead associated with collecting long-lived objects. Generational garbage collection can significantly reduce pause times and improve overall application responsiveness.
Common Memory Management Issues

Despite the advantages of garbage collection, several common memory management issues can arise in applications that utilize it. One significant issue is the phenomenon known as “memory bloat,” which occurs when an application consumes more memory than necessary due to inefficient object allocation patterns or excessive retention of references to objects that are no longer needed. This can lead to increased garbage collection activity, resulting in performance degradation and longer pause times during execution.
Another prevalent issue is “stop-the-world” pauses, which occur during certain types of garbage collection processes. In a stop-the-world event, all application threads are paused while the garbage collector runs its cycle. This can be particularly problematic for real-time applications or those requiring high availability, as even brief pauses can disrupt user experience or lead to timeouts in critical operations.
Developers must be aware of these potential pitfalls and design their applications accordingly to mitigate the impact of garbage collection on performance.
Optimizing Memory Usage through Garbage Collection
Optimizing memory usage through effective garbage collection strategies can significantly enhance application performance and resource utilization. One approach involves minimizing object creation by reusing existing objects whenever possible. Object pooling is a design pattern that allows developers to maintain a pool of reusable objects rather than creating new instances each time an object is needed.
This reduces the frequency of garbage collection cycles and helps maintain a more stable memory footprint. Another optimization technique is to carefully manage object references. By ensuring that references to objects are released when they are no longer needed, developers can help the garbage collector identify unreachable objects more efficiently.
This practice not only aids in timely memory reclamation but also reduces the risk of memory leaks. Additionally, using weak references for large objects or caches can allow them to be collected when memory pressure increases without impacting the application’s core functionality.
Best Practices for Garbage Collection
| Metric | Description | Typical Value | Unit |
|---|---|---|---|
| Heap Size | Total memory allocated for objects | 256 – 2048 | MB |
| GC Pause Time | Time application is paused during garbage collection | 10 – 200 | ms |
| GC Frequency | Number of garbage collection events per minute | 1 – 10 | events/min |
| Objects Collected | Number of objects reclaimed during GC | 1000 – 100000 | objects |
| Allocation Rate | Rate at which new objects are allocated | 10 – 500 | MB/s |
| Promotion Rate | Rate at which objects are promoted to older generation | 1 – 50 | MB/min |
| GC Throughput | Percentage of time not spent in GC | 80 – 99 | % |
Implementing best practices for garbage collection can lead to more efficient memory management and improved application performance. One fundamental practice is to understand the specific garbage collection algorithm employed by the programming language or runtime environment being used. Each algorithm has its own characteristics and tuning parameters that can be adjusted based on application requirements.
g., G1, CMS) that can be selected based on workload characteristics. Another best practice involves profiling and monitoring memory usage during development and testing phases. Tools such as profilers can provide insights into object allocation patterns, helping developers identify hotspots where excessive memory allocation occurs.
By analyzing these patterns, developers can refactor code to reduce unnecessary allocations and improve overall efficiency. Additionally, regular performance testing under realistic workloads can help identify potential garbage collection issues before they impact production environments.
Monitoring and Tuning Garbage Collection

Monitoring and tuning garbage collection is essential for maintaining optimal application performance over time. Most modern programming environments provide built-in tools for monitoring garbage collection activity, such as logging GC events and tracking memory usage metrics. For example, Java’s JVM offers options to enable detailed GC logging, which can provide insights into pause times, heap usage, and object allocation rates.
Tuning garbage collection parameters can also yield significant performance improvements. For instance, adjusting heap size settings can help accommodate varying workloads and reduce frequency of collections. In Java, parameters like `-Xms` (initial heap size) and `-Xmx` (maximum heap size) allow developers to control how much memory is allocated to the JVM at startup and its upper limit during execution.
Additionally, selecting an appropriate garbage collector based on application needs—such as using G1 for low-latency applications—can further enhance performance by minimizing pause times.
Tools for Analyzing Memory Usage and Garbage Collection
A variety of tools are available for analyzing memory usage and garbage collection behavior across different programming environments. In Java, tools like VisualVM and Eclipse Memory Analyzer (MAT) provide graphical interfaces for monitoring heap usage, identifying memory leaks, and analyzing object retention paths. These tools allow developers to visualize memory consumption over time and pinpoint areas where optimizations may be necessary.
For .NET applications, tools such as dotMemory offer similar capabilities for profiling memory usage and analyzing garbage collection events. These tools enable developers to track down excessive allocations or long-lived objects that may be contributing to performance issues. Additionally, many integrated development environments (IDEs) come equipped with built-in profiling tools that facilitate real-time monitoring of memory usage during application execution.
Future Trends in Garbage Collection Technology
As software development continues to evolve, so too does the technology surrounding garbage collection. One emerging trend is the integration of machine learning techniques into garbage collection algorithms. By leveraging data-driven approaches, future garbage collectors may be able to predict object lifetimes more accurately and optimize collection cycles accordingly.
This could lead to more efficient memory management with reduced pause times and improved application responsiveness.
This approach has gained traction in modern programming languages and runtimes as it addresses one of the most significant drawbacks of traditional garbage collection methods.
As hardware capabilities continue to advance with multi-core processors becoming commonplace, concurrent garbage collectors will likely become more prevalent in future software architectures. In conclusion, understanding garbage collection is essential for developers aiming to create efficient applications that manage memory effectively. By exploring various algorithms, addressing common issues, optimizing usage patterns, adhering to best practices, monitoring performance, utilizing analysis tools, and staying informed about future trends, developers can harness the full potential of garbage collection technology in their software development endeavors.
Garbage collection is a crucial aspect of memory management in programming languages, ensuring that unused objects are automatically reclaimed to free up resources. For those interested in exploring related concepts in logic and language, the article on A.J. Ayer: Language, Truth, and Logic provides an insightful perspective on how language structures our understanding of truth, which can be metaphorically linked to the clarity and efficiency that garbage collection brings to programming.


+ There are no comments
Add yours