


Website performance metrics are essential indicators that provide insights into how well a website is functioning. These metrics encompass various aspects, including load times, responsiveness, and user engagement. Load time, for instance, is a critical metric that measures the time it takes for a webpage to fully display its content.
Research indicates that a mere one-second delay in load time can lead to a 7% reduction in conversions. This statistic underscores the importance of optimizing load times to enhance user experience and drive business outcomes. Another vital metric is the bounce rate, which reflects the percentage of visitors who leave a site after viewing only one page.
A high bounce rate may indicate that users are not finding what they expect or that the content is not engaging enough to encourage further exploration.
By analyzing these metrics, website owners can identify areas for improvement and make data-driven decisions to enhance overall performance.
Key Takeaways
- Website performance metrics include page load time, bounce rate, conversion rate, and user engagement.
- Key performance indicators (KPIs) for website performance should be specific, measurable, achievable, relevant, and time-bound.
- Analytics tools like Google Analytics and Adobe Analytics can be used to track website performance and user behavior.
- Analyzing user behavior and engagement on the website can provide insights into user preferences and areas for improvement.
- Optimizing website content and design based on analytics data can lead to improved user experience and higher conversion rates.
Setting Key Performance Indicators (KPIs) for Website Performance
Establishing Key Performance Indicators (KPIs) is crucial for measuring the success of a website. KPIs serve as benchmarks that help organizations assess their performance against specific goals. Common KPIs for website performance include conversion rates, average load times, and user retention rates.
For example, if an e-commerce site aims to increase sales, tracking the conversion rate—the percentage of visitors who complete a purchase—becomes paramount. This metric allows businesses to evaluate the effectiveness of their marketing strategies and website design in driving sales. Moreover, setting KPIs should be aligned with the overall business objectives.
For instance, if a company seeks to enhance brand awareness, metrics such as unique visitors and social media shares may be prioritized. By defining clear KPIs, organizations can focus their efforts on areas that directly impact their goals. Regularly reviewing these indicators enables businesses to adapt their strategies in response to changing market conditions or user preferences.
Using Analytics Tools to Track Website Performance
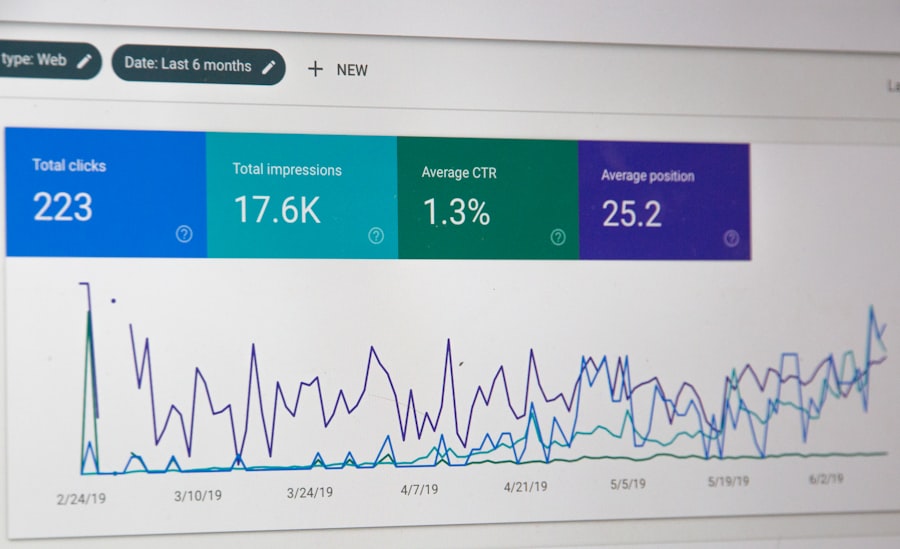
To effectively monitor website performance, leveraging analytics tools is indispensable. Tools such as Google Analytics provide comprehensive data on user behavior, traffic sources, and site performance metrics. With Google Analytics, website owners can track real-time data, allowing them to see how users interact with their site at any given moment.
This capability is particularly useful for identifying sudden spikes in traffic or unusual patterns that may require immediate attention. In addition to Google Analytics, other tools like SEMrush and Ahrefs offer valuable insights into SEO performance and keyword rankings. These tools can help identify which keywords are driving traffic and how well the site ranks in search engine results pages (SERPs).
By utilizing a combination of analytics tools, businesses can gain a holistic view of their website’s performance and make informed decisions based on data rather than assumptions.
Analyzing User Behavior and Engagement on the Website
| Page | Number of Visits | Time Spent on Page (in minutes) | Bounce Rate (%) |
|---|---|---|---|
| Homepage | 1500 | 3.5 | 40% |
| Product Page | 1200 | 5.2 | 35% |
| Blog Page | 800 | 7.1 | 25% |
Understanding user behavior is fundamental to improving website performance. Analyzing how users navigate through a site can reveal valuable insights into their preferences and pain points. Heatmaps, for instance, visually represent where users click most frequently on a webpage.
This information can help identify which elements are engaging users and which may be causing frustration or confusion. Furthermore, tracking user engagement metrics such as scroll depth can provide insights into how far down a page users typically scroll before losing interest. If users consistently drop off at a certain point, it may indicate that the content is not compelling enough or that the layout needs adjustment.
By delving into these behavioral patterns, website owners can make targeted improvements that enhance user experience and encourage deeper engagement with the content.
Optimizing Website Content and Design Based on Analytics Data
Once analytics data has been collected and analyzed, the next step is to optimize website content and design accordingly. Content optimization involves refining existing content to improve its relevance and appeal to users. For example, if analytics reveal that certain blog posts receive high traffic but low engagement, it may be beneficial to update those posts with more engaging visuals or additional information to keep users on the page longer.
A well-designed website should facilitate easy navigation and provide a seamless user experience. If analytics indicate that users struggle to find specific information or frequently abandon their shopping carts, it may be time to reevaluate the design elements contributing to these issues.
By making data-driven adjustments to both content and design, businesses can create a more user-friendly environment that encourages visitors to stay longer and engage more deeply.
Utilizing A/B Testing to Improve Website Performance

A/B testing is a powerful method for optimizing website performance by comparing two versions of a webpage to determine which one performs better. This technique allows businesses to test specific changes—such as different headlines, images, or call-to-action buttons—against each other in real-time. For instance, an e-commerce site might test two variations of a product page: one with a prominent “Buy Now” button and another with a more subtle design.
By analyzing conversion rates for each version, the business can identify which design drives more sales. The beauty of A/B testing lies in its ability to provide concrete evidence of what works best for a specific audience. It eliminates guesswork by relying on actual user interactions rather than assumptions about preferences.
However, it’s essential to ensure that tests are statistically significant; running tests for too short a period or with too few visitors can lead to inconclusive results. By systematically implementing A/B testing as part of their optimization strategy, businesses can continuously refine their websites based on real user feedback.
Monitoring Website Performance Trends and Patterns
Monitoring trends and patterns in website performance over time is crucial for understanding long-term user behavior and identifying potential issues before they escalate. Regularly reviewing performance metrics allows businesses to spot anomalies or shifts in user engagement that may indicate underlying problems. For example, if there is a sudden drop in traffic after a website redesign, it may suggest that users are struggling with the new layout or that important content has been inadvertently removed.
Additionally, tracking seasonal trends can provide valuable insights into user behavior fluctuations throughout the year. E-commerce sites often experience spikes in traffic during holiday seasons or special sales events; understanding these patterns enables businesses to prepare adequately by optimizing their websites for increased traffic and ensuring that server capacity can handle the influx of visitors. By maintaining vigilance over performance trends, organizations can proactively address issues and capitalize on opportunities as they arise.
Implementing Strategies to Improve Website Performance Based on Analytics Insights
The final step in enhancing website performance involves implementing strategies derived from analytics insights. This process begins with prioritizing areas for improvement based on data analysis—whether it’s optimizing load times, enhancing content quality, or redesigning navigation structures. For instance, if analytics indicate that mobile users experience slower load times compared to desktop users, prioritizing mobile optimization becomes essential.
Moreover, continuous improvement should be part of an organization’s culture; regularly revisiting analytics data allows businesses to adapt their strategies in response to evolving user needs and technological advancements. Implementing changes based on insights should also involve testing their effectiveness through methods like A/B testing or user feedback surveys. By fostering an iterative approach to website optimization grounded in analytics insights, organizations can create a dynamic online presence that meets user expectations while driving business success.
In conclusion, understanding website performance metrics is foundational for any organization aiming to succeed online. By setting clear KPIs, utilizing analytics tools effectively, analyzing user behavior, optimizing content and design based on data insights, employing A/B testing strategies, monitoring trends over time, and implementing informed strategies for improvement, businesses can significantly enhance their website performance. This comprehensive approach not only improves user experience but also drives conversions and fosters long-term customer loyalty in an increasingly competitive digital landscape.
If you are interested in delving deeper into the world of analytics, you may want to check out this article on transition to chaos: understanding symbolic dynamics and chaos. This article explores the concept of chaos theory and how it relates to symbolic dynamics, providing valuable insights that can be applied to the field of analytics. By understanding the principles of chaos and symbolic dynamics, analysts can gain a deeper understanding of complex systems and make more informed decisions based on data.


+ There are no comments
Add yours